Results
We describe our results in the same order as explained in previous section. We start with the observed statistics, followed by the supervised and unsupervised machine learned feature importance before summarizing our insights and translating them into useful actionable recommendations to CHWs.
1. Observed Statistics
Our analysis of the dataset examined patient readmission patterns before applying machine learning models. Observed data provides baseline trends and benchmarks for evaluating predictive models. Patients were categorized into three groups based on their engagement with Community Health Workers (CHWs): Non-Engaged, Engaged, and Surveyed. The observed readmission rates are as follows:
- Non-Engaged Patients : 35.03% readmission rate.
- Engaged Patients : 18.89% readmission rate
- Surveyed Patients : 19.49% readmission rate.
Engagement with CHWs reduced readmission rates by nearly half compared to the Non-Engaged group. The readmission rate for Surveyed patients was slightly higher than for Engaged patients, suggesting that while SDoH survey participation adds value, it does not significantly enhance the benefits of CHW engagement alone.
Further examination of demographic factors provided insights into the characteristics of each patient group:
- High-Risk Readmit Status: This factor was the most critical predictor of readmissions in the Non-Engaged group. Patients categorized as high-risk had higher readmission rates compared to other subgroups.
These trends emphasize the need for targeted interventions for high-risk patients, particularly those not engaged with CHWs.
The observed data establishes baselines that guide the evaluation of machine learning models. Features identified through modeling were compared against these observed baselines using the following criteria:
- The feature’s readmission rate must exceed the baseline rate for the respective patient group.
- The feature must represent a significant number of patients (at least 10).
- There must be a notable difference between readmitted and non-readmitted patients within the feature.
These criteria ensure that only significant features are recommended for CHW interventions.
2. Supervised Learning
The performance of RF and LR models was evaluated using key metrics: Accuracy, Sensitivity, Specificity, F1-score, and AUC* . For conciseness, we report the accuracy (correctness) and AUC which is a measure of the predictive capabilities of the classifier or in our case, the ability of the model to distinguish between readmitted and non-readmitted patients. The RF model consistently outperformed LR, particularly in sensitivity and AUC, indicating its superiority in identifying patients at risk for ED readmission.
In our study, RF outperformed LR due to its ability to handle the complexity of the data, including a combination of demographic information, CHW logs, and SDoH features. The ensemble approach is known to help reduce overfitting while providing insight into the importance of each feature. The RF model achieved an accuracy of 0.76 (95% CI: 0.75 - 0.77), and an AUC of 0.77 (95% CI: 0.76 - 0.78) for the surveyed patients subgroup.
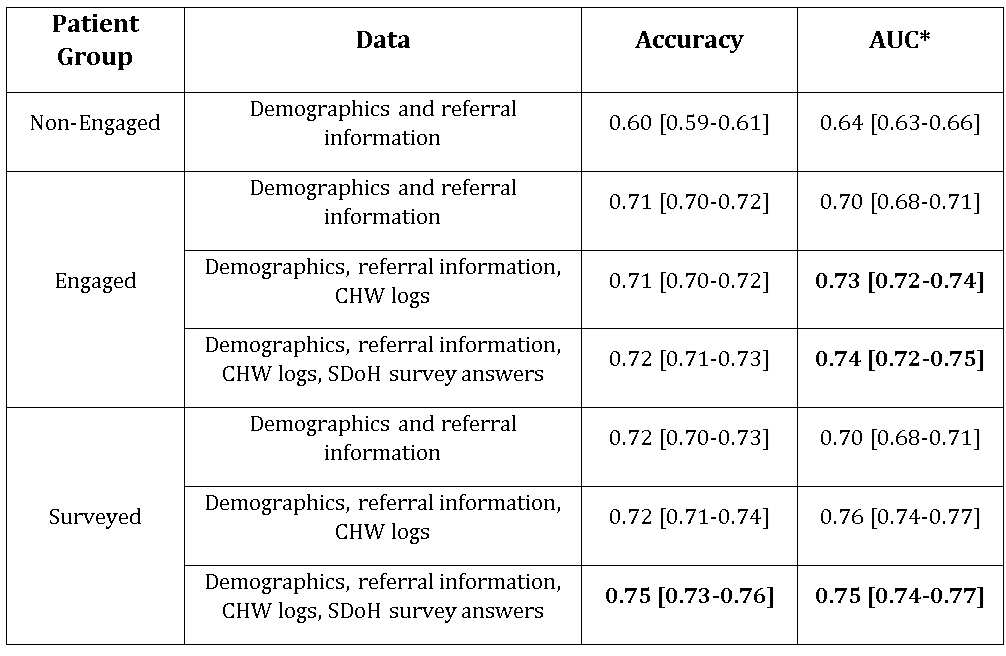
It is interesting to note that the readmissions amongst the non-engaged patients are the least predictable at baseline (using just the demographics and referral information), with an accuracy of about 60% and an AUC of 64%. Using the same data for engaged and surveyed patients, the accuracy already improves by about 10% without any additional data. The accuracy does not significantly increase with the addition of CHW logs and SDoH data respectively, except in the case of surveyed patients with all available data.
On the other hand, the ability of the classifier to learn the difference between positive and negative cases (readmitted vs non-readmitted patients) clearly improves with the addition of CHW logs for engaged and surveyed patients.
To summarize, we focused on the clearly increased classification capabilities of the classifier for surveyed patients with all available data, which shows a 5% increase from the baseline with no overlapping confidence intervals (0.70 [0.68-0.71] to 0.75 [0.74-0.77] )
3. Supervised Learning Feature Importance
Feature importance analysis was conducted to determine which specific factors had the greatest influence on the prediction of ED readmissions among different patient groups, using RF and LR models. The analysis is crucial for understanding where Community Health Workers (CHWs) should prioritize their efforts to ensure targeted interventions, which can ultimately enhance patient outcomes.
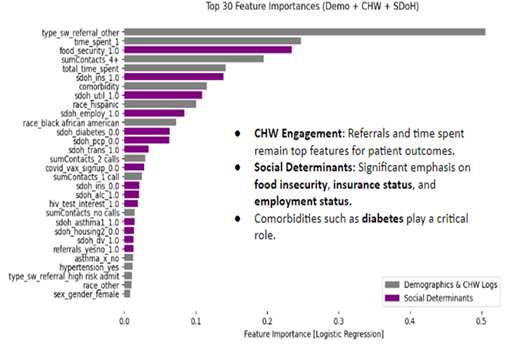
Among the top features identified by the RF were time spent with CHWs, type of referral (particularly high-risk vs. ED referral), the number of contact attempts, and crucially some social determinants of health (SDoH) indicators such as food security and insurance status. The visualization of these top 30 features, represented in the provided plots (Figure 3 and Figure 4), highlights the key drivers behind the model's predictions. While we had previously demonstrated that important CHW logs features were among the most important features, we now show that food security is ranked tenth and third in the RF and LR model respectively, while insurance is ranked 12th and 6th in the same order. In both cases, these two are the top two SDoH features amongst the 30 most important features. The next agreement in SDoH feature importance is employment status but the agreements, and the magnitude of the importance significantly decreases beyond 14 features.
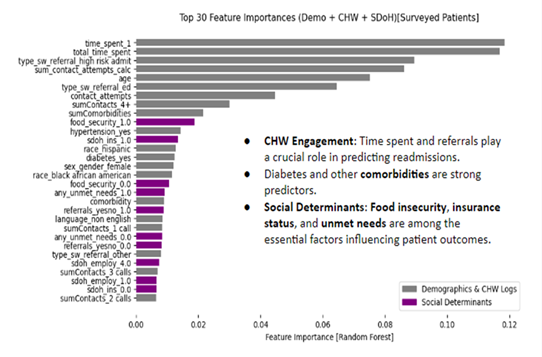
- Time Spent with CHWs
- The duration of engagement with Community Health Workers (CHWs) was one of the strongest predictors of reduced ED readmissions. Consistent and meaningful interactions foster trust, improve patient assessments, and enhance adherence to follow-up care plans.
- Referral Type (High-Risk vs. ED Referral)
- Patients classified as high-risk by social workers had significantly higher readmission rates. This highlights the need for CHWs to focus on these patients with comprehensive care plans and intensive follow-ups to prevent recurrent ED visits.
- Number of Contact Attempts
- Patients who received four or more contact attempts had a higher likelihood of readmission, suggesting they have more complex healthcare needs. CHWs should consider alternative, more tailored intervention strategies for such patients.
- Food Security and Insurance Status
- Food insecurity and insurance type were critical social determinants of health (SDoH) influencing readmissions. Patients struggling with food access were at a greater risk, emphasizing the need for CHWs to integrate food assistance into care plans. Similarly, disparities in healthcare access based on insurance status (e.g., public vs. uninsured) contributed to readmission risks, warranting targeted support strategies.
The Surveyed patient group presented different but complementary insights into the factors driving readmissions. The type of referral was again a significant factor—patients admitted as high-risk had a readmission rate of 42%, while those from the Emergency Department had a much lower rate of 6.8%. Regarding the frequency of CHW interactions, patients who received four or more contacts had a readmission rate of 37.8%, which was notably higher than patients who had only one or two contacts, with readmission rates of 3.3% and 4.2%, respectively. Hypertension again emerged as a key factor, with patients with hypertension having a readmission rate of 33.3%, compared to 11.6% for those without hypertension. These findings reiterate the results from the engaged patients in general. The presence of referrals played a crucial role in determining outcomes for the Surveyed group. Patients who received appropriate referrals had a readmission rate of 34.3%, while those without referrals had a significantly lower rate of 12.8%. This finding suggests that while referrals are generally intended to assist patients, there might be mismatches in how these referrals are being used, requiring a reassessment of how resources are being allocated to meet patient needs.
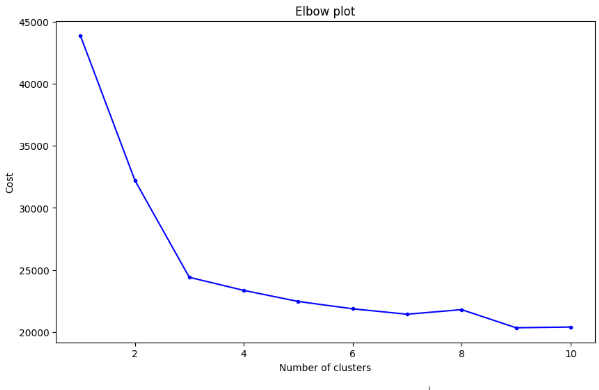
Unsupervised Learning Results
Using the elbow method with our K-Modes clustering, we determined that the optimum number of clusters was three. The clustering uncovered three clusters that were easily categorized based on their engagement based on the percentages of patients that were non-engaged, engaged or surveyed.
Summary of Clustering Analysis
- Cluster 0 (Largest Group – 47.54%)
- Comprised 1,033 patients with the lowest readmission rate.
- All patients were engaged with CHWs, and around 40% had completed SDoH surveys.
- The findings confirm that engagement reduces readmissions. Increasing survey participation within this group could further improve patient support and monitoring.
- Cluster 1 (Non-Engaged Patients – 33.59%)
- Consisted of 730 patients with the highest readmission rate.
- These patients had lower comorbidity levels and a higher representation of non-Hispanic individuals.
- The lack of engagement suggests a need for greater outreach efforts to encourage CHW participation and reduce readmissions.
- Cluster 2 (High-Engagement, Complex Cases – 18.87%)
- Included 410 patients with high levels of both CHW engagement and SDoH survey participation (96% engaged).
- Despite engagement, this group had relatively higher readmission rates, likely due to comorbidities and social challenges.
- This cluster had the highest percentage of Hispanic patients and the most complex health conditions.
- Findings suggest the need for tailored interventions targeting chronic conditions like hypertension and addressing unmet social needs to improve outcomes.
The clustering analysis highlights that while engagement helps reduce readmissions, additional interventions are required for high-risk groups, particularly those with significant comorbidities and social challenges.